
Which window sales metrics should you track?
A window sale is a chain. A lead comes in, the office books it, a rep runs the appointment, the homeowners sign, and the sale either survives the cancellation period and the financing or it doesn't. Each link has its own number. Watch only the last one and you'll know sales are down without knowing where they leaked.
Here are the metrics most worth keeping. Names change from shop to shop (one company's "sit" is another's "demo"), so write your definitions down and count the same way every month. The lingo itself is in window sales terms.
Window sales metrics and how to work them out
Leads
- Formula
- Every homeowner who asked about windows, from every source
- What it tells you
- Whether marketing is bringing in enough people to work with.
Issued leads
- Formula
- Leads that became a booked appointment and were handed to a rep
- What it tells you
- The rep's starting count. Reps are judged on what they were sent to, not on every inquiry.
Issue rate
- Formula
- Issued leads ÷ leads
- What it tells you
- What the office loses before anyone drives out: slow callbacks, wrong numbers, price shoppers.
Demo rate
- Formula
- Demos ÷ issued leads
- What it tells you
- How many booked visits become a full presentation to everyone who decides.
Close rate (closing ratio)
- Formula
- Sales ÷ demos
- What it tells you
- How the rep, the price and the product hold up at the table.
Average sale
- Formula
- Dollars sold ÷ number of sales
- What it tells you
- Job size: a few windows or the whole house, and whether upgrades stick.
Cancellation rate
- Formula
- Sales canceled or unfunded ÷ sales written
- What it tells you
- Deals that came apart after the signature.
Net sales
- Formula
- Dollars sold, minus canceled and unfunded sales
- What it tells you
- What actually goes to production and gets paid.
NSLI (net sales per lead issued)
- Formula
- Net sales ÷ issued leads
- What it tells you
- What each lead handed to a rep turns into, every step included.
Cost per net sale
- Formula
- Marketing spend ÷ sales that stayed sold
- What it tells you
- What a lead source really costs you for each job.
| Metric | Formula | What it tells you |
|---|---|---|
| Leads | Every homeowner who asked about windows, from every source | Whether marketing is bringing in enough people to work with. |
| Issued leads | Leads that became a booked appointment and were handed to a rep | The rep's starting count. Reps are judged on what they were sent to, not on every inquiry. |
| Issue rate | Issued leads ÷ leads | What the office loses before anyone drives out: slow callbacks, wrong numbers, price shoppers. |
| Demo rate | Demos ÷ issued leads | How many booked visits become a full presentation to everyone who decides. |
| Close rate (closing ratio) | Sales ÷ demos | How the rep, the price and the product hold up at the table. |
| Average sale | Dollars sold ÷ number of sales | Job size: a few windows or the whole house, and whether upgrades stick. |
| Cancellation rate | Sales canceled or unfunded ÷ sales written | Deals that came apart after the signature. |
| Net sales | Dollars sold, minus canceled and unfunded sales | What actually goes to production and gets paid. |
| NSLI (net sales per lead issued) | Net sales ÷ issued leads | What each lead handed to a rep turns into, every step included. |
| Cost per net sale | Marketing spend ÷ sales that stayed sold | What a lead source really costs you for each job. |
What counts as an issued lead and a demo?
An issued lead is a lead the office has turned into a set appointment and given to a rep to run. It's the line between the office's numbers and the rep's. A rep can't be blamed for a lead nobody booked, and the office can't take credit for a sale until a rep has been sent.
A demo is an appointment where the rep ran the whole presentation, through the price, to everyone who decides. Give every other ending its own code: nobody home, rescheduled, canceled on the way, one owner home, or no demo because the job didn't fit (a renter, one cracked pane, a house outside your area). If you only record "sold" or "not sold," you can't tell a rep with a closing problem from an office with a booking problem.
The one-owner visit is the hardest to code. Legacy Remodeling of Pittsburgh told Remodeling magazine in 2007 that its reps find out on arrival whether there's a real buyer: if there is, they run the full presentation; if not, they may measure and book a return visit2. Whatever your rule is, put it in writing. If each rep decides what counts as a demo, every close rate on the board means something different. Getting both owners there in the first place is covered in window appointment setting.
Is there a benchmark for demo rate? We couldn't find a published windows figure we could source, so we don't quote one. The nearest number comes from a lead seller: Elevarus estimates set-to-sit ratios of 45 to 65% on shared windows leads3. That's one seller's estimate for bought leads that other companies are also calling. Referrals and past customers can behave very differently, which is one more reason to track every source on its own.
How do you calculate your window sales close rate?
Divide sales by demos. A rep who ran 40 full demos last month and wrote 12 sales closed 12 in 40, or 3 in 10. Close rate and closing ratio mean the same thing. What changes from company to company is the bottom number: some divide by issued leads or by every appointment, which drags the rate down and mixes the office's work into the rep's. Divide by demos, and say so whenever you compare numbers with someone else.
For a yardstick, Siro, whose benchmarks come from appointments its own customers recorded, puts the average windows and doors close rate at 29.1%, ahead of every other trade in its data and above the 26.9% all-trades figure1. That's the figure as published in October 2026. We don't know exactly how each company behind that number defines a demo or a sale, so compare against your own trend first and the benchmark second. More sourced figures, each with its date, are in window and door sales statistics.
Then cut your close rate these ways before you act on it:
- By rep. The gap between your best rep and your newest one is your training plan.
- By lead source. A source can fill the calendar with demos and still close almost none of them.
- First visit vs overall. Sales on the night against sales after a second visit; the trade-offs are in one-call close window sales.
- Written vs net. Sales signed against sales still standing once cancellations and financing have cleared.
- Over enough demos. A rep with ten demos in a month moves ten points with a single sale, so read reps on a rolling three months, not on one week.
What is net sales per lead issued (NSLI)?
Take the dollars that stayed sold after cancellations and failed financing, and divide by every lead a rep was handed. That's NSLI. It's the one number that holds the whole chain: it falls when demos fall apart, when closes slip, when jobs shrink and when signed sales cancel.
That's why owners like it for comparing reps and lead sources. A rep who only works the easy demos can post a strong close rate and a weak NSLI. A source with a decent close rate but small jobs, or a lot of cancellations, gets caught the same way.
NSLI is the chain multiplied together: demo rate × close rate × the share of sales that stay sold × the average net sale. Say 7 of every 10 issued leads become demos, 3 of every 10 demos close, and 1 sale in 10 cancels or doesn't fund. Then 0.7 × 0.3 × 0.9 comes to about 0.19, so each issued lead is worth about a fifth of your average sale. Those rates are made up for the example; put in your own from the last twelve months.
The formula also shows where to push. Because the links multiply, lifting any one of them by a tenth lifts NSLI by a tenth. That lets you weigh a better confirmation call (demo rate), a training push (close rate), bigger jobs (average sale) and a better post-close (cancellations) on the same scale, and spend your effort on the weakest link.
NSLI is most useful next to what an issued lead costs you. Divide a source's spend by the leads from it that were issued, and set that cost beside the same source's NSLI. A source whose issued leads eat a big slice of what they sell is the first one to cut, however cheap its leads look. What leads cost by channel is in window replacement leads.
We couldn't find a published NSLI benchmark for windows that we could source, so set your target from your own last twelve months, by source.
Why should you count net sales, not sales written?
Because a signed contract can still walk away. Under the FTC's Cooling-Off Rule, a homeowner who buys at home can cancel a sale of $25 or more until midnight of the third business day after it, and the seller has to tell them about that right and give them a cancellation form4. Many states add their own rules, so check yours with your lawyer. This is general information, not legal advice.
Financing opens a second gap: a sale that depends on a loan isn't real until the lender approves it. Count four things every month, the same way: written, canceled, unfunded and net.
Then watch cancellations rep by rep. A rep whose first-night close rate keeps climbing while cancellations climb with it isn't closing better; the homeowners are just saying no a few days later. JLC suggests answering the objections you expect before they come up and telling customers about their right to cancel as ways to cut cancellations5. What to do before you leave the house, and when a homeowner calls to cancel, is in window sale cancellations. If your pay plan is figured on net sales, put that in writing; see window sales commission.
How do you track window sales metrics by lead source and by rep?
Record the same fields on every lead from the day it arrives, in whatever you use: a CRM, a spreadsheet, a whiteboard. Almost every metric on this page is just these fields counted by month, by rep and by source.
Review reps weekly and sources monthly. Rank sources on cost per net sale and NSLI, not on what each lead costs. Let a new source run on a set budget until its leads have had time to sell, cancel or die before you judge it. Running the weekly sales meeting around these numbers is covered in managing a window sales team.
What to record on every window lead
Source
- What to write
- The exact ad, seller, show or referrer, not just "internet"
- Why it matters
- Lets you rank sources by NSLI and cost per net sale.
Arrived and first contact
- What to write
- Date and time of each
- Why it matters
- Slow first calls turn up later as a weak issue rate.
Issued to
- What to write
- The rep and the appointment date
- Why it matters
- Starts the rep's count.
Result code
- What to write
- Demo, one owner home, nobody home, rescheduled, or no demo with the reason
- Why it matters
- Keeps demo rate and close rate honest across reps.
Options and prices shown
- What to write
- Each option quoted, at the price quoted
- Why it matters
- Shows whether reps cut price to close.
Sold
- What to write
- Yes or no, the amount and the product
- Why it matters
- Close rate and average sale.
Canceled or unfunded
- What to write
- The date and the reason
- Why it matters
- Turns written sales into net sales.
Render shown
- What to write
- Yes or no, and which look
- Why it matters
- Lets you test, on your own numbers, whether showing their own house changes how your demos end.
| Field | What to write | Why it matters |
|---|---|---|
| Source | The exact ad, seller, show or referrer, not just "internet" | Lets you rank sources by NSLI and cost per net sale. |
| Arrived and first contact | Date and time of each | Slow first calls turn up later as a weak issue rate. |
| Issued to | The rep and the appointment date | Starts the rep's count. |
| Result code | Demo, one owner home, nobody home, rescheduled, or no demo with the reason | Keeps demo rate and close rate honest across reps. |
| Options and prices shown | Each option quoted, at the price quoted | Shows whether reps cut price to close. |
| Sold | Yes or no, the amount and the product | Close rate and average sale. |
| Canceled or unfunded | The date and the reason | Turns written sales into net sales. |
| Render shown | Yes or no, and which look | Lets you test, on your own numbers, whether showing their own house changes how your demos end. |
The result text after every appointment
[Last name], [town]. Both owners home, full demo, priced [number] windows in [option A] and [option B].
Result: no sale. What's left to decide, in their words: [reason]. Render sent tonight: [look]. Next step: call [day].
Same format every time, sent before the rep pulls away, so the office codes every rep's result the same way.
Which window sales numbers mislead managers?
- Close rate on leads instead of demos. It blames the rep for the office's misses.
- Letting reps code their own visits with no written rule. A weak visit marked "no demo" quietly lifts a close rate.
- Celebrating written sales. Until the cancellation period passes and the loan clears, it's a maybe.
- One number for every source. A strong referral month can hide a bought-lead source that loses money on every job.
- Benchmarks from other trades. Siro's own figures put windows and doors above its all-trades average1, so an all-trades number is the wrong yardstick for a window team.
- Price per lead. A cheap lead that never sits is the most expensive lead you buy.
- One month of data. Small counts swing; use a rolling three months for reps and a full test for sources.
Where the render fits in your numbers
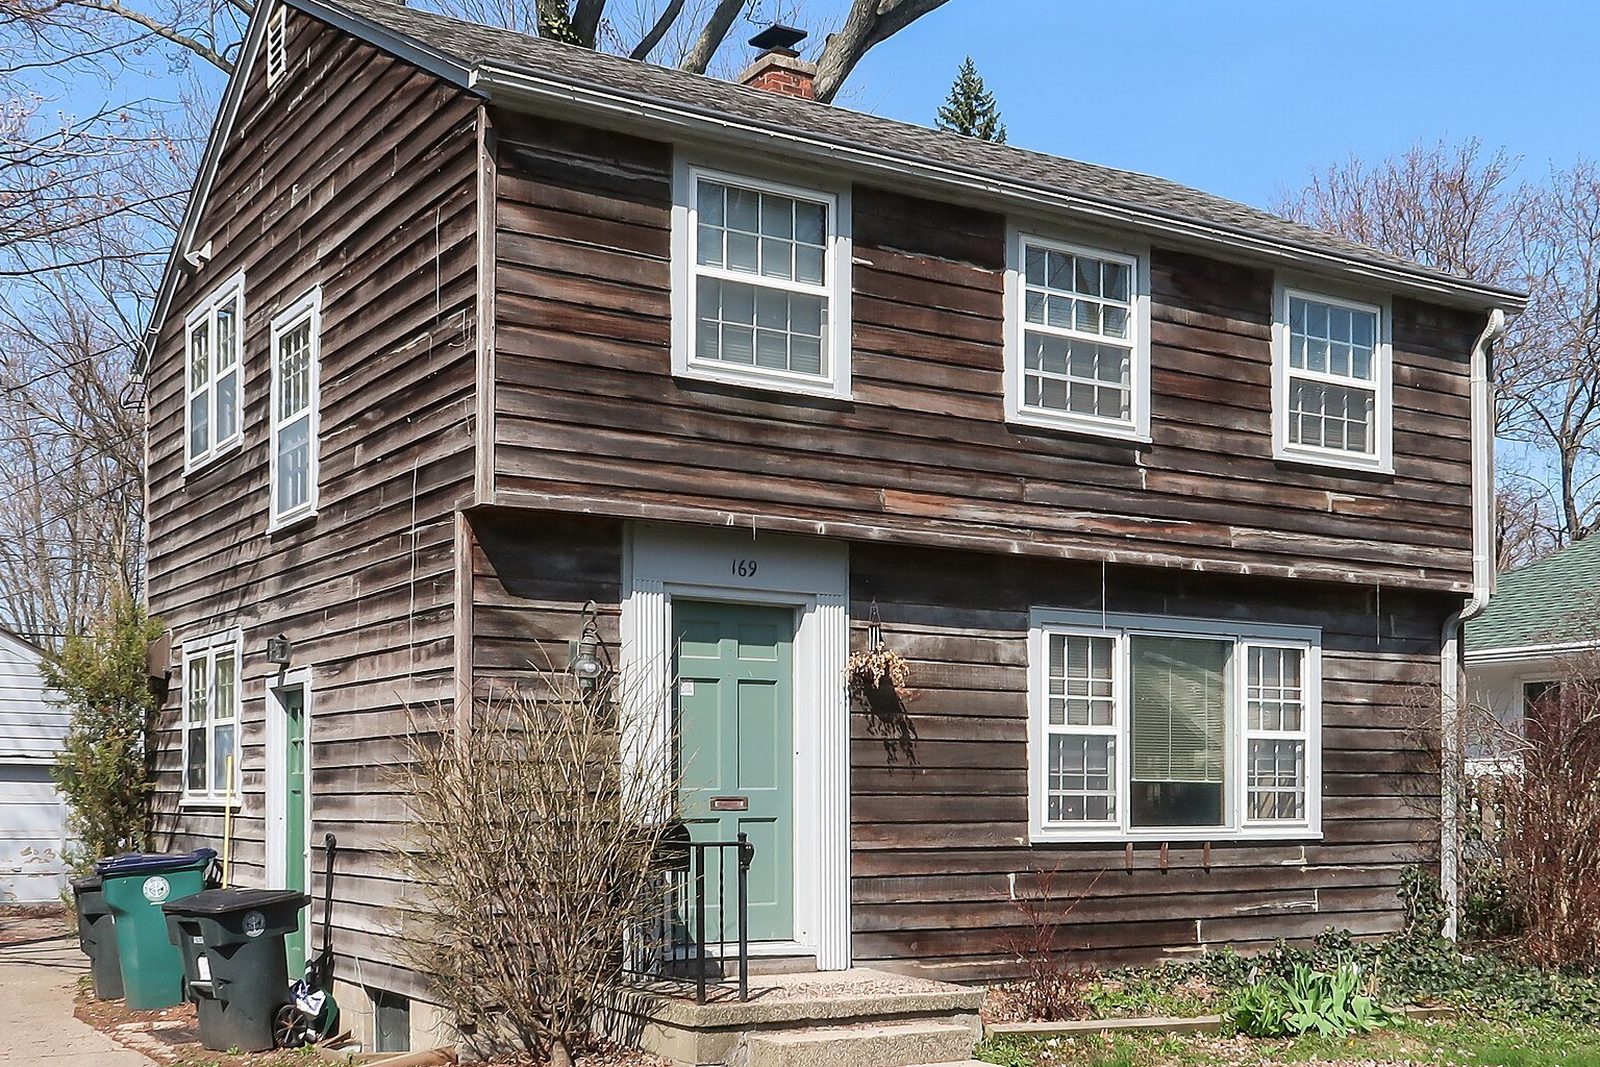
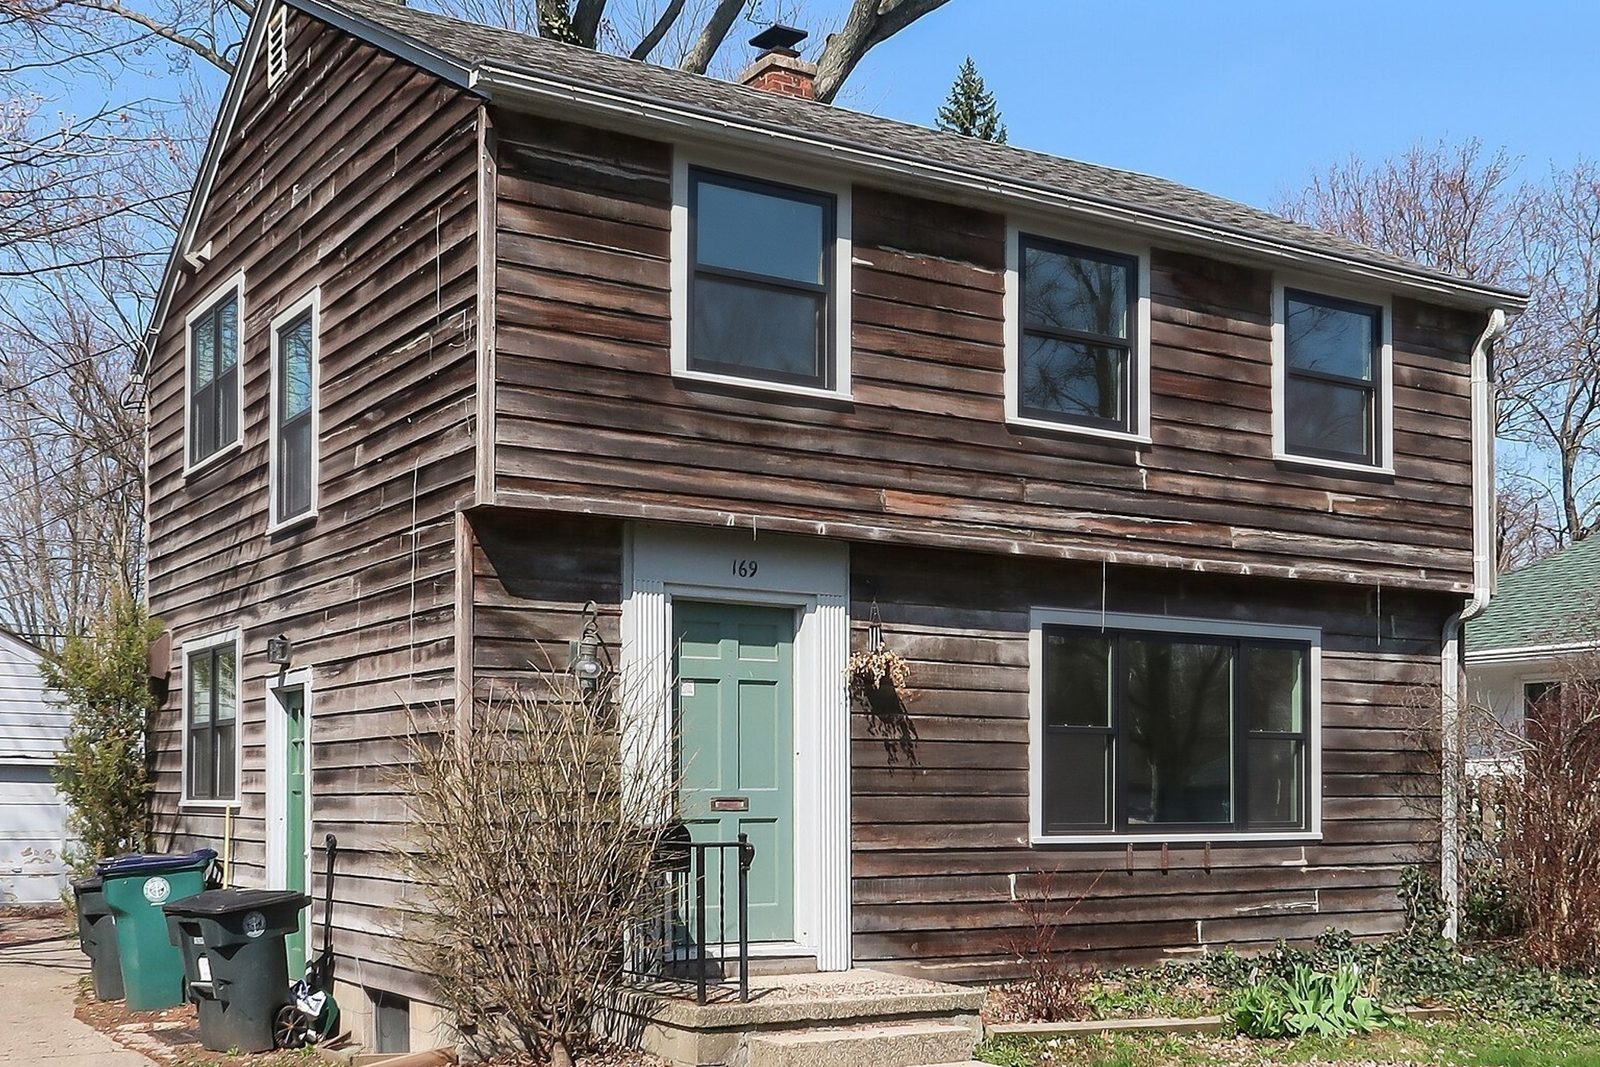
The render works in the step between demo and sale. Once you've measured and know which look they lean toward, take one photo, pick the frame material, color and grilles you're quoting, and show the homeowners their own house in 30 seconds, before the price goes on the table.
It also keeps a no-sale demo alive. Text the render that night, so the house they liked is on their phone while they talk it over. After a sale, send the render of what they ordered with your next-steps message, so everyone in the house has the same picture of what's coming.
Then measure it like everything else. Add the "render shown" field to your result codes and, after a few months, compare close rate, average sale and cancellations on demos with and without one. WindowRender is new, so we have no results to quote you; your own records are the honest test.